About me

I am a relatively new member of the Data Science community, having started exploring this field only recently. However, I have always had a fondness of using and exploring data and figures, and I quickly fell in love with this field after discovering the amazing bridge between data and business that Data Science forms.
Ever since, I have been diving into various topics and projects for my master study, but also in the form of side-projects and courses.

Skills and languages

Tags: Python, SQL, Keras, PyTorch, Spark, MongoDB, NLP, Sklearn, Tableau

Through my master study and several side projects I have become quite familiar with coding in both Python and SQL. I have done several projects using these languages, including NLP, image recognition, various forms of machine learning, and neural networks. Regarding database usage, I have used services such as PostgresSQL, SQLite, and MySQL, as well MongoDB and the use of Data/Delta lakes.

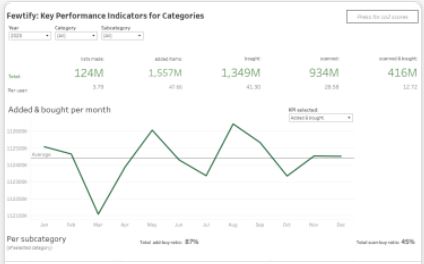
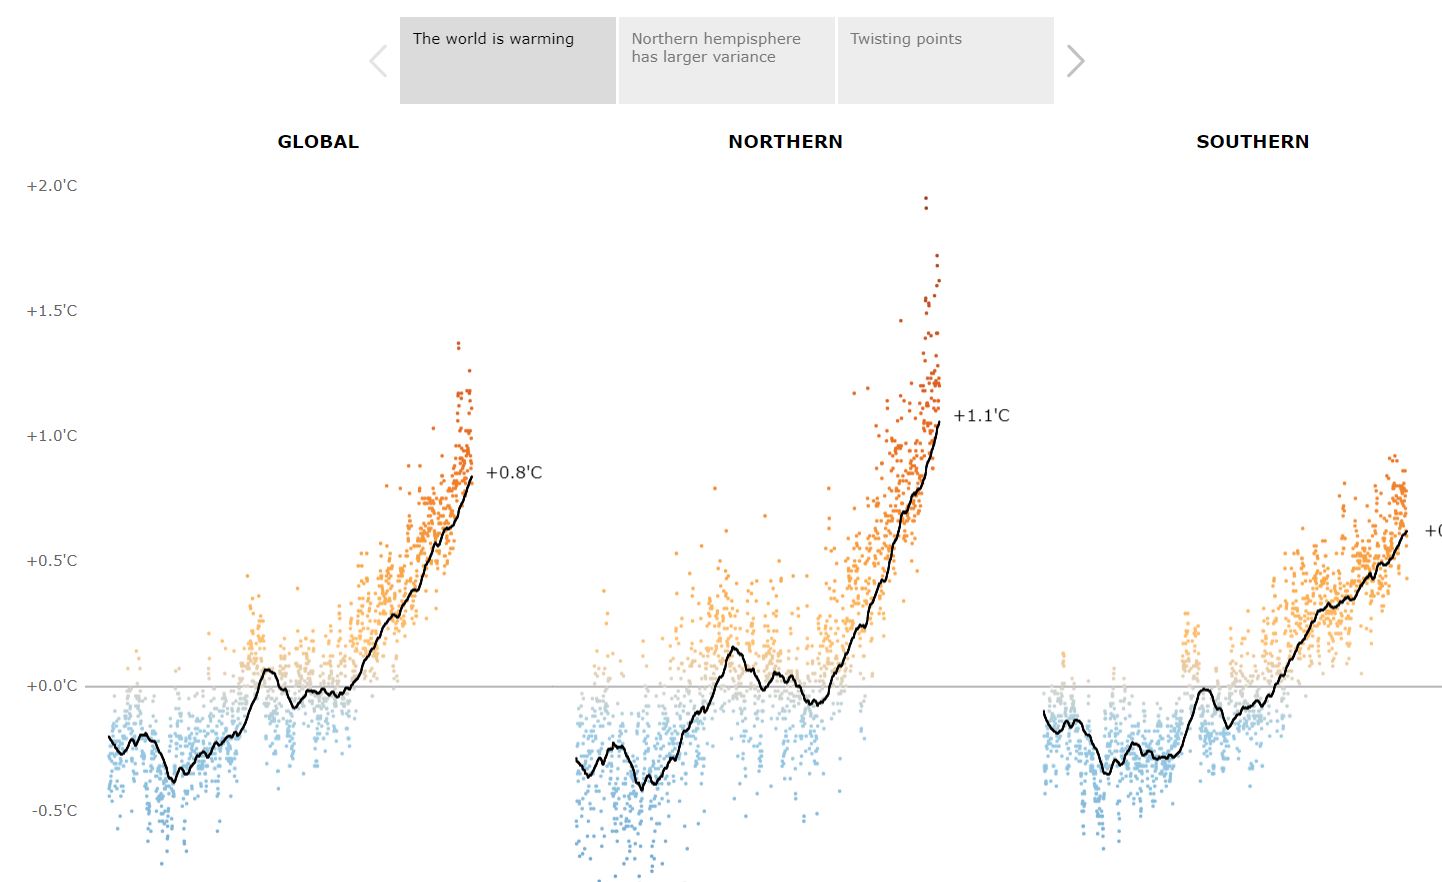
Regarding the visualization of data analyses and findings, I have learned working with Tableau, having designed several visualizations and dashboards. This adding to my knowledge of Python libraries on visualization. Further skills I have started acquiring relate to the use of GitHub, cloud services, Spark, Keras, PyTorch and even touching on the topic of quantum computing.

These skills greatly match my background in business-focused studies, where I learned how to think about and use data from a business perspective.

Projects and experience

Projects, dashboards, and certificates related to data science.

Spam mail classification

Using NLP techniques, feature generation, and ML algorithms to classify spam and real mails.

Mobile game AB testing

Performing EDA and hypothesis testing to see whether the scores of two variations of a mobile game statistically differ.

Keras Simpsons images classification

Using Keras to train a nn capable of classifying images. Including transfer learning and data augmentation.

SQL, EDA, and hypothesis testing

EDA, hypothesis testing, and time-series analysis with the use of SQL, pandas, and visualizations.

SQL EU football EDA

EDA of an EU football database using SQL.

Tableau Dashboard

A dashboard designed for a master's final project. It provides insight into KPIs for a fictional application.

Tableau Graphical Story

Graphs and visualizations representing the development of global warming and key twisting points.

DataCamp Certificate

Data Analyst course that covers a wide range of libraries, data loading/pre-processing/exploration techniques, and SQL (66 hours).